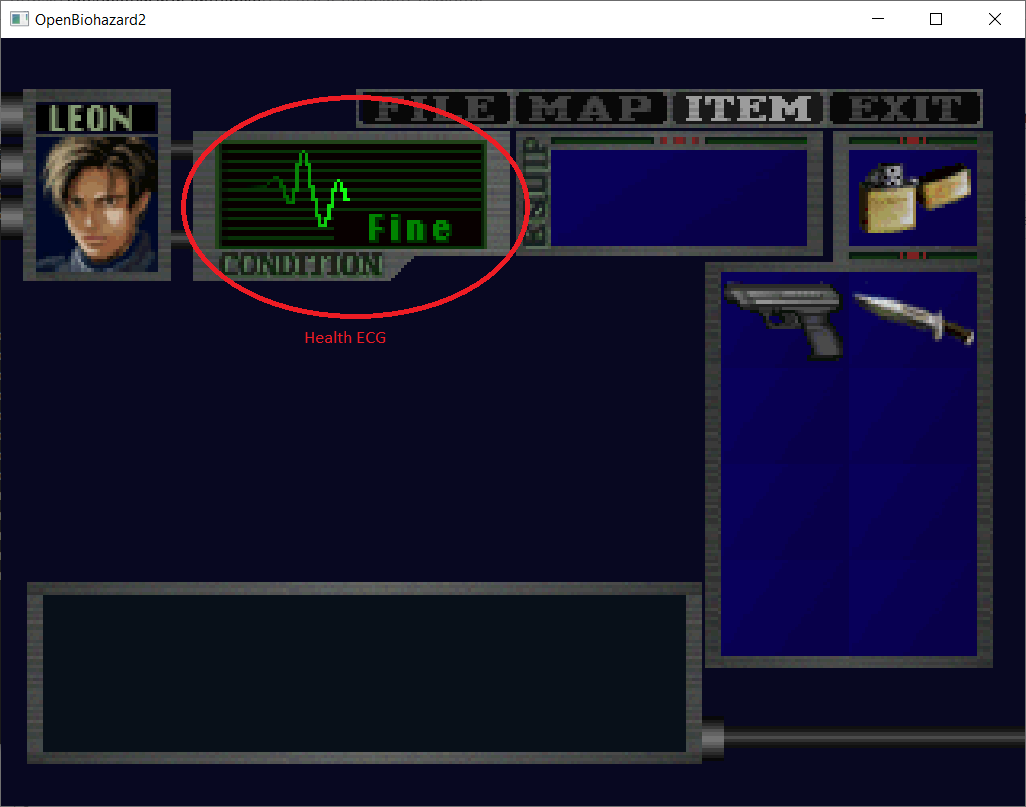
The Inventory Screen’s Health ECG
When the player opens up the inventory screen in the top part of the screen and they check their health, they can see the health ECG (Electrocardiogram) animation rendered.
In this article, we will go over how this animation is rendered in the original game and a reimplemented version of it in the Go programming language.
Initial Curve
We will first start with the initial shape of the health ECG curve.
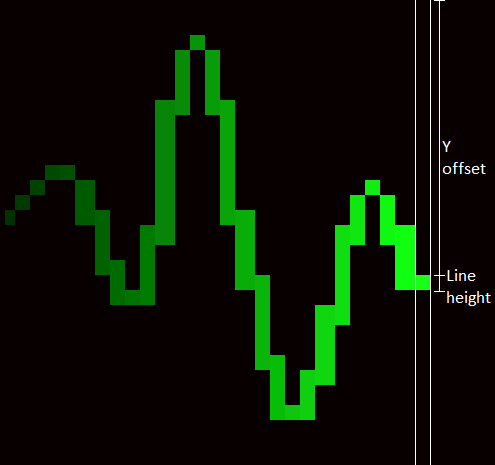
There are multiple ways to model curved lines. In this case, the curve is composed of multiple vertical lines instead of one single curved line. When the vertical lines are combined together, the result will appear as a single contiguous curved line.
The curve has 80 vertical lines. For each line, it is defined by a (yOffset, height) pair.
- yOffset: The position from the top edge of the screen.
- height: The height of the vertical line.
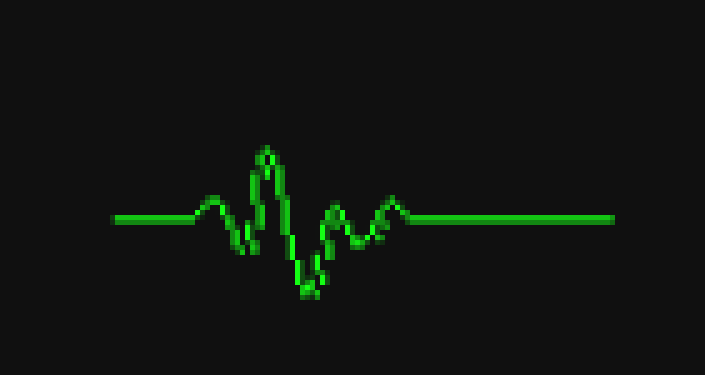
Depending on the player’s status, e.g. fine, caution, danger, etc., the shape of each health ECG curve is defined differently. The curve is hardcoded in the code as an array. The color and gradient is defined separately in RGB form, where the minimum value is 0 and the maximum value is 255. For example, If we render the entire ECG curve for the “Fine” status as described by the array and set the color to green, it would look like this:
Gradient
In the game, to create the effect of the health ECG curve moving from left to right, only a portion of the curve is rendered at any time. Another change is to draw the line with different colors so that the curve blends in with the black background.
The code will try to draw multiple vertical lines from right to left. As we go from right to left, each line gets gradually darker. The color of the vertical line is defined by subtracting the gradient from the adjacent line on the right.
For example, if the current line color is green (20, 255, 20) and the gradient is (1, 8, 1)
- The first line on the right at position x will have color (20, 255, 20).
- The second line, which is one pixel to the left of the first line, at position x - 1 will have color (20, 255, 20) - (1, 8, 1) = (19, 247, 19).
- The third line at position x - 2 will have color (19, 247, 19) - (1, 8, 1) = (18, 239, 18).
- The fourth line at position x - 3 will have color (17, 231, 17) and so on.
You can see in the below image, the lines on the right of the screen have a bright color. As the lines to the left are drawn, the lines gradually get darker. Given the current x, the program will calculate the line’s topmost Y using yOffset from the top of the screen and draw a line downwards based on the line height.
If we observe the color of each line from right to left, the gradient would eventually converge to black (0, 0, 0) because negative RGB values aren’t allowed. The game will only draw up to 32 vertical lines at most to the left of the initial vertical line. If any vertical line goes to the left side of the ECG at x = 0, the line won’t be rendered.
Sliding window
In the below image, the left column shows the health ECG that is rendered in the game. The right column shows the entire curve drawn and a sliding window is drawn around the curve to show how the animation works.
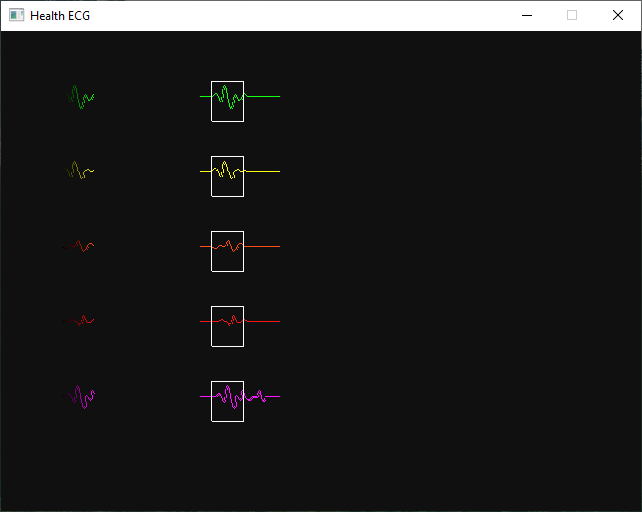
For each frame, the current vertical line position will be incremented by 1, starting from x = 0 and going all the way up to x = 127. At each x, a series of vertical lines will be drawn and the colors of each of those lines will be set as described in the gradient section. This increment makes the animation smooth, since you gradually see the ECG line move from left to the right per frame.
If you want to see the full source code of how the health ECG works, you can view the full project https://github.com/OpenBiohazard2/HealthECG. This project takes code from OpenBiohazard2.